Solar based climate forecasting was pioneered by Albuquerque hydrologist Michael Wallace in 2016 who published testable multiyear forecasts for three major watersheds across New Mexico and the Southern Rocky Mountains. Wallace demonstrated that in many catchments, those water and snowpacks expressed high lagged correlations to solar activity over several years. Since then, our mapping of the reach of solar forcing of climate has extended to every significant aspect of climate from winds to snowpacks and can be applied to specific regions around the world, especially much of the Great Plains and the Western US.
For as low as a $500 fee, customers can contact us via email with a latitude and longitude coordinate for the area that they would like us to deploy an annual average forecast for one to four years later. This can apply to annual surface temperature, surface specific humidity, evaporation, precipitation, cloudiness index, wind magnitude, and others. Some products are also available at a seasonal or monthly scale.
Costs are finalized after a consultation to set additional conditions and expectations. For example, many coordinates will be ruled out, simply because the multi-linear precursor correlations are not significant enough for our methods to apply effectively at this time.
EXAMPLE A featured below is a demonstration exercise for temperatures for Albuquerque, New Mexico. It is a purely regression-based product and accordingly dependent upon the similarities between various data-based time series.
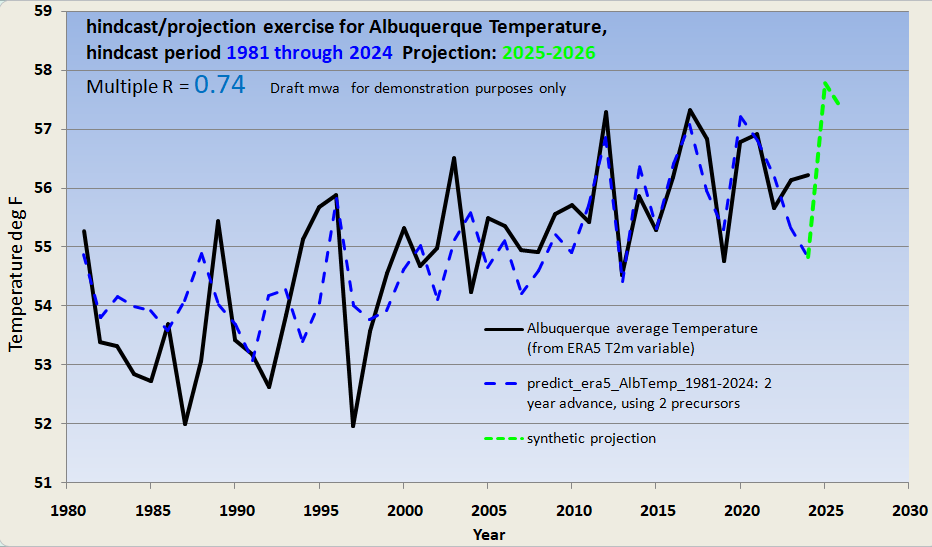
Our method assumes that the closer the precursor series align, and the more persistent and continuous the alignment, the better the forecast will be. But we are always mindful that hindsight (the blue curve) is 20/20. Better foresight depends not only on prior history but proven hydrologic skills, including in dynamics and uncertainty quantification. Through decades of attention to these requirements, our team works to deliver the best and most accurate multiyear climate forecasts.
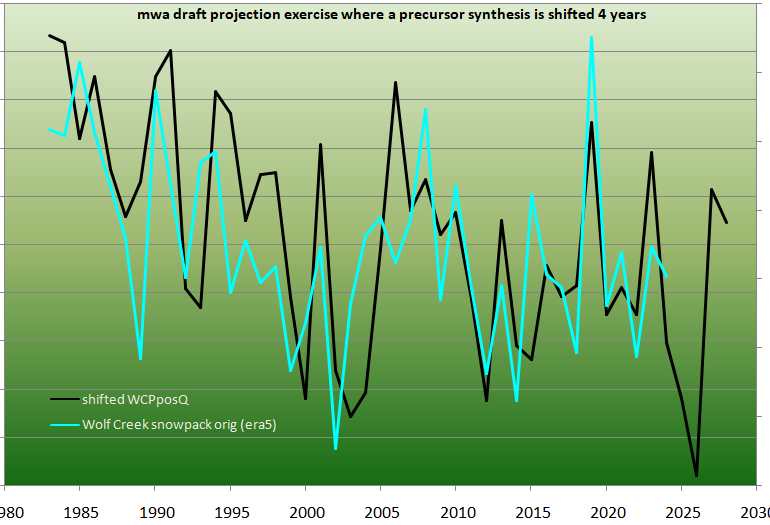
EXAMPLE B relates to predictability for snowpack at Wolf’s Creek Pass in Southern Colorado. In this simple demonstration, a prior synthesis of two time series is shifted a few years to the right. An actual forecast and hindcast for 1 to 4 years of lag would be dependent on quantitative exercises.
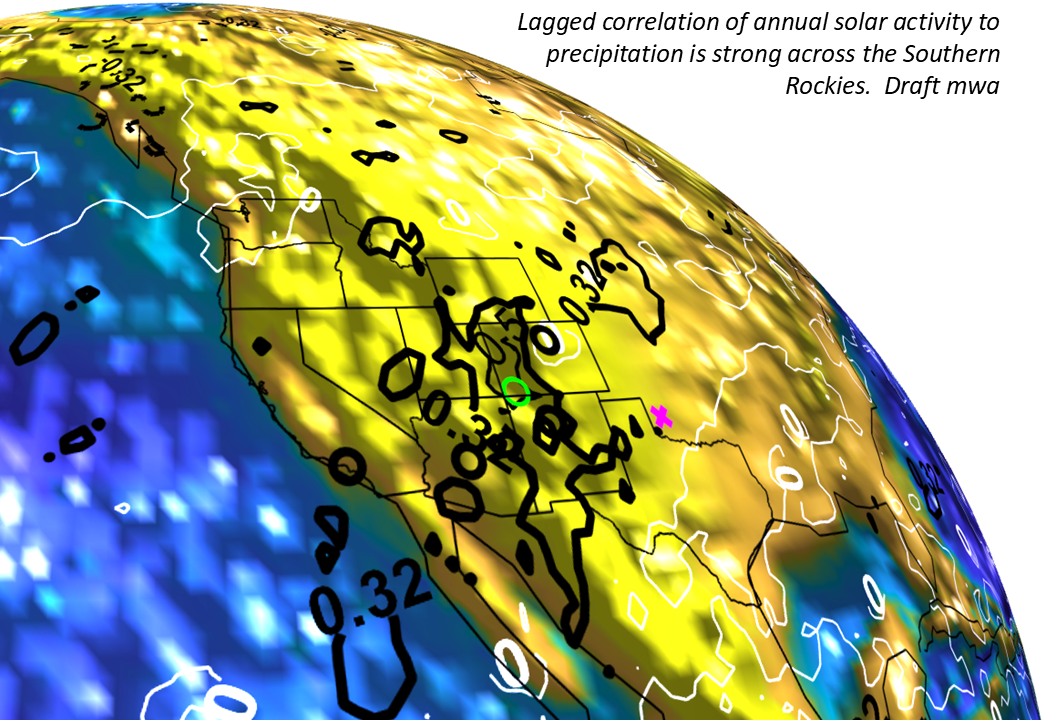
We developed global maps relating ERA5 precipitation data to precursors including again sunspot numbers (SSNs). Here is an example which overlaps consistently with our snowpack region, and much of the Upper Colorado River Watershed, given our solar forcing perspective.
The correlations seem impressive, and they have drawn academic and research attention. But accurate forecasts can be developed from merging solar with other precursors, as we demonstrate from winds to waters to clouds.
EXAMPLE C Short animation of an iterative improvement in a two year projection exercise (hindcast only) for the annual flows of the Gila River near Gila, New Mexico. We apply iterative methods at times to find the best precursors for future projections.
All products are for illustration purposes only.
In this example from recent ERA5 data, different regions warm as others cool. Is this predictable? We think in many cases it can be, and our early adopter predictions have been fairly accurate.
Through a custom subscription service, businesses can benefit from proven climate forecasting performance and accuracy, with a no-nonsense focus on your targeted coordinates, for temperature, moisture (including snowpack where relevant), winds, and cloudiness. Consider a $500 subscription for one location per year. Contact us at info@abeqas.com
ERA5 data from
https://cds.climate.copernicus.eu/datasets/reanalysis-era5-single-levels-monthly-means?tab=overview
other data from the USGS and
 5505total visits,2visits today