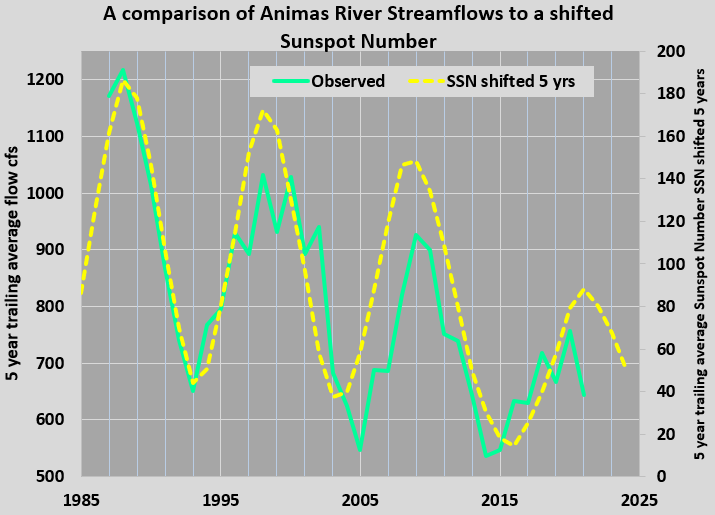
Long time readers would be aware of MWA developments in Solar based hydroclimatological forecasting. There is a peer reviewed publication as well [1], which outlines the theory and the practice. It happens to feature the Animas River which emerges from the high altitude catchments of the Southern Rocky Mountains.
In the featured image above, I’ve built upon the discussion section of that paper and simply have shifted the Sunspot Number time series forward by 5 years to see how it aligns with the Animas flows. This Solar comparison to the Animas River is highly correlated (R = 0.85) and statistically significant (p << 0.01). The significance is accordingly such that there is over a 99.9% probability that Solar forcing and flows of the Animas River are related.
One might wonder where else in the world can such strong correlations be found between terrestrial moisture and Solar cycles. I recommend that you download and read [1] as a start. But I don’t mind sharing some ongoing work, in which I’ve plotted the zero lag correlation (R) between atmospheric moisture (UCAR ERAI “EP” value) over the headwaters of the Animas River to everywhere else on the planet. This coverage is featured in the following two graphics.
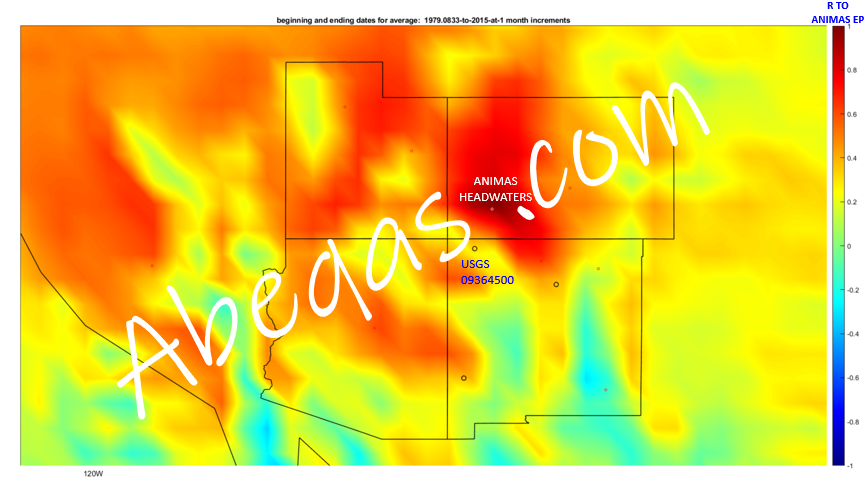
Zero lag correlation to Animas Headwater footprint atmospheric EP over the Southern Rocky Mountains and surrounding areas.

Expanded view
You can begin to interpret by considering that any region which is highly correlated to the Animas moisture signature, may also be highly correlated to the Solar cycle signature.
There will always be more questions, even for a Solar forcing paradigm, and those questions are most welcome. I’ll continue to follow moisture patterns across the Western US and beyond as time permits. This year I plan to examine snowfalls and more ENSO and PDO news, along with glaciations and related (as I see it) sea level changes. But rivers will always be key, and among rivers, the Animas will always be premier [1].
I haven’t been to the Animas this season yet so these pics of the nearby Rio Grande will have to do for now.

Snow and Moisture, late Fall 2020 in the Middle Rio Grande Valley just downstream of the Southern Rockies

I turned around to take this photo of a Middle Rio Grande Conservancy District spillway just north of beautiful yet climatologically troubled Albuquerque, NM
PREVIEW OF PENDING POSTS
THE BOGUS BUTTERFLY EFFECT?
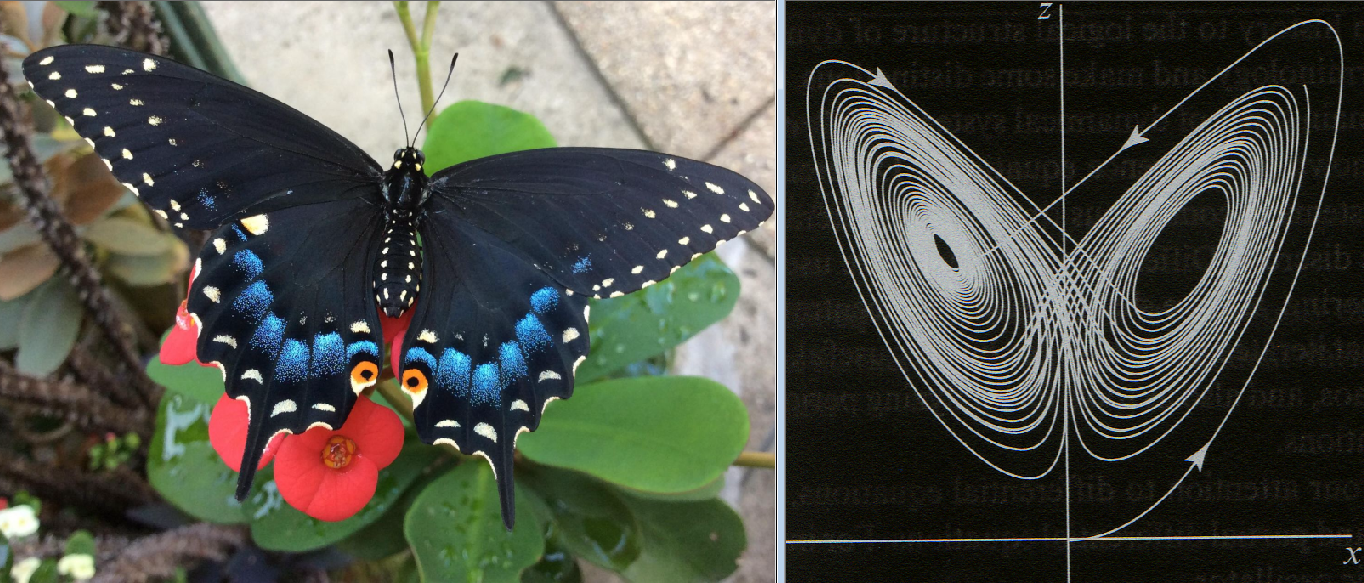
Left: Eastern Black Swallowtail raised and photographed by Vanna Wallace. Right: Figure 1.1.1 of Lorenz strange attractor from Strogatz [2].
In Strogatz’s narrative (a fellow academic to Lorenz at MIT), the metaphor explained why Lorenz couldn’t forecast weather. It wasn’t Lorenz’s equation that was deficient, it was all of mathematics being usurped by wild chaos. With CHAOS, not only did scientists get a pass from forecasting accountability, now the merest microflap of a butterfly’s wings could be attributed to have caused a major coastal – threatening cyclone. In addition to the fact that Solar forcing paradigm can project climate years in advance (at least in some places) here’s why one can entertain skepticism of the butterfly effect: [to be continued in the actual post]
REFERENCES
[1] Wallace, M.G., 2019, Application of lagged correlations between solar cycles and hydrosphere components towards sub-decadal forecasts of streamflows in the Western US. Hydrological Sciences Journal, Oxford UK Volume 64 Issue 2. doi: 10.1080/02626667.2019.
[2] Strogatz, S.H., 2015 NONLINEAR DYNAMICS AND CHAOS Westview Press
 11331total visits,2visits today