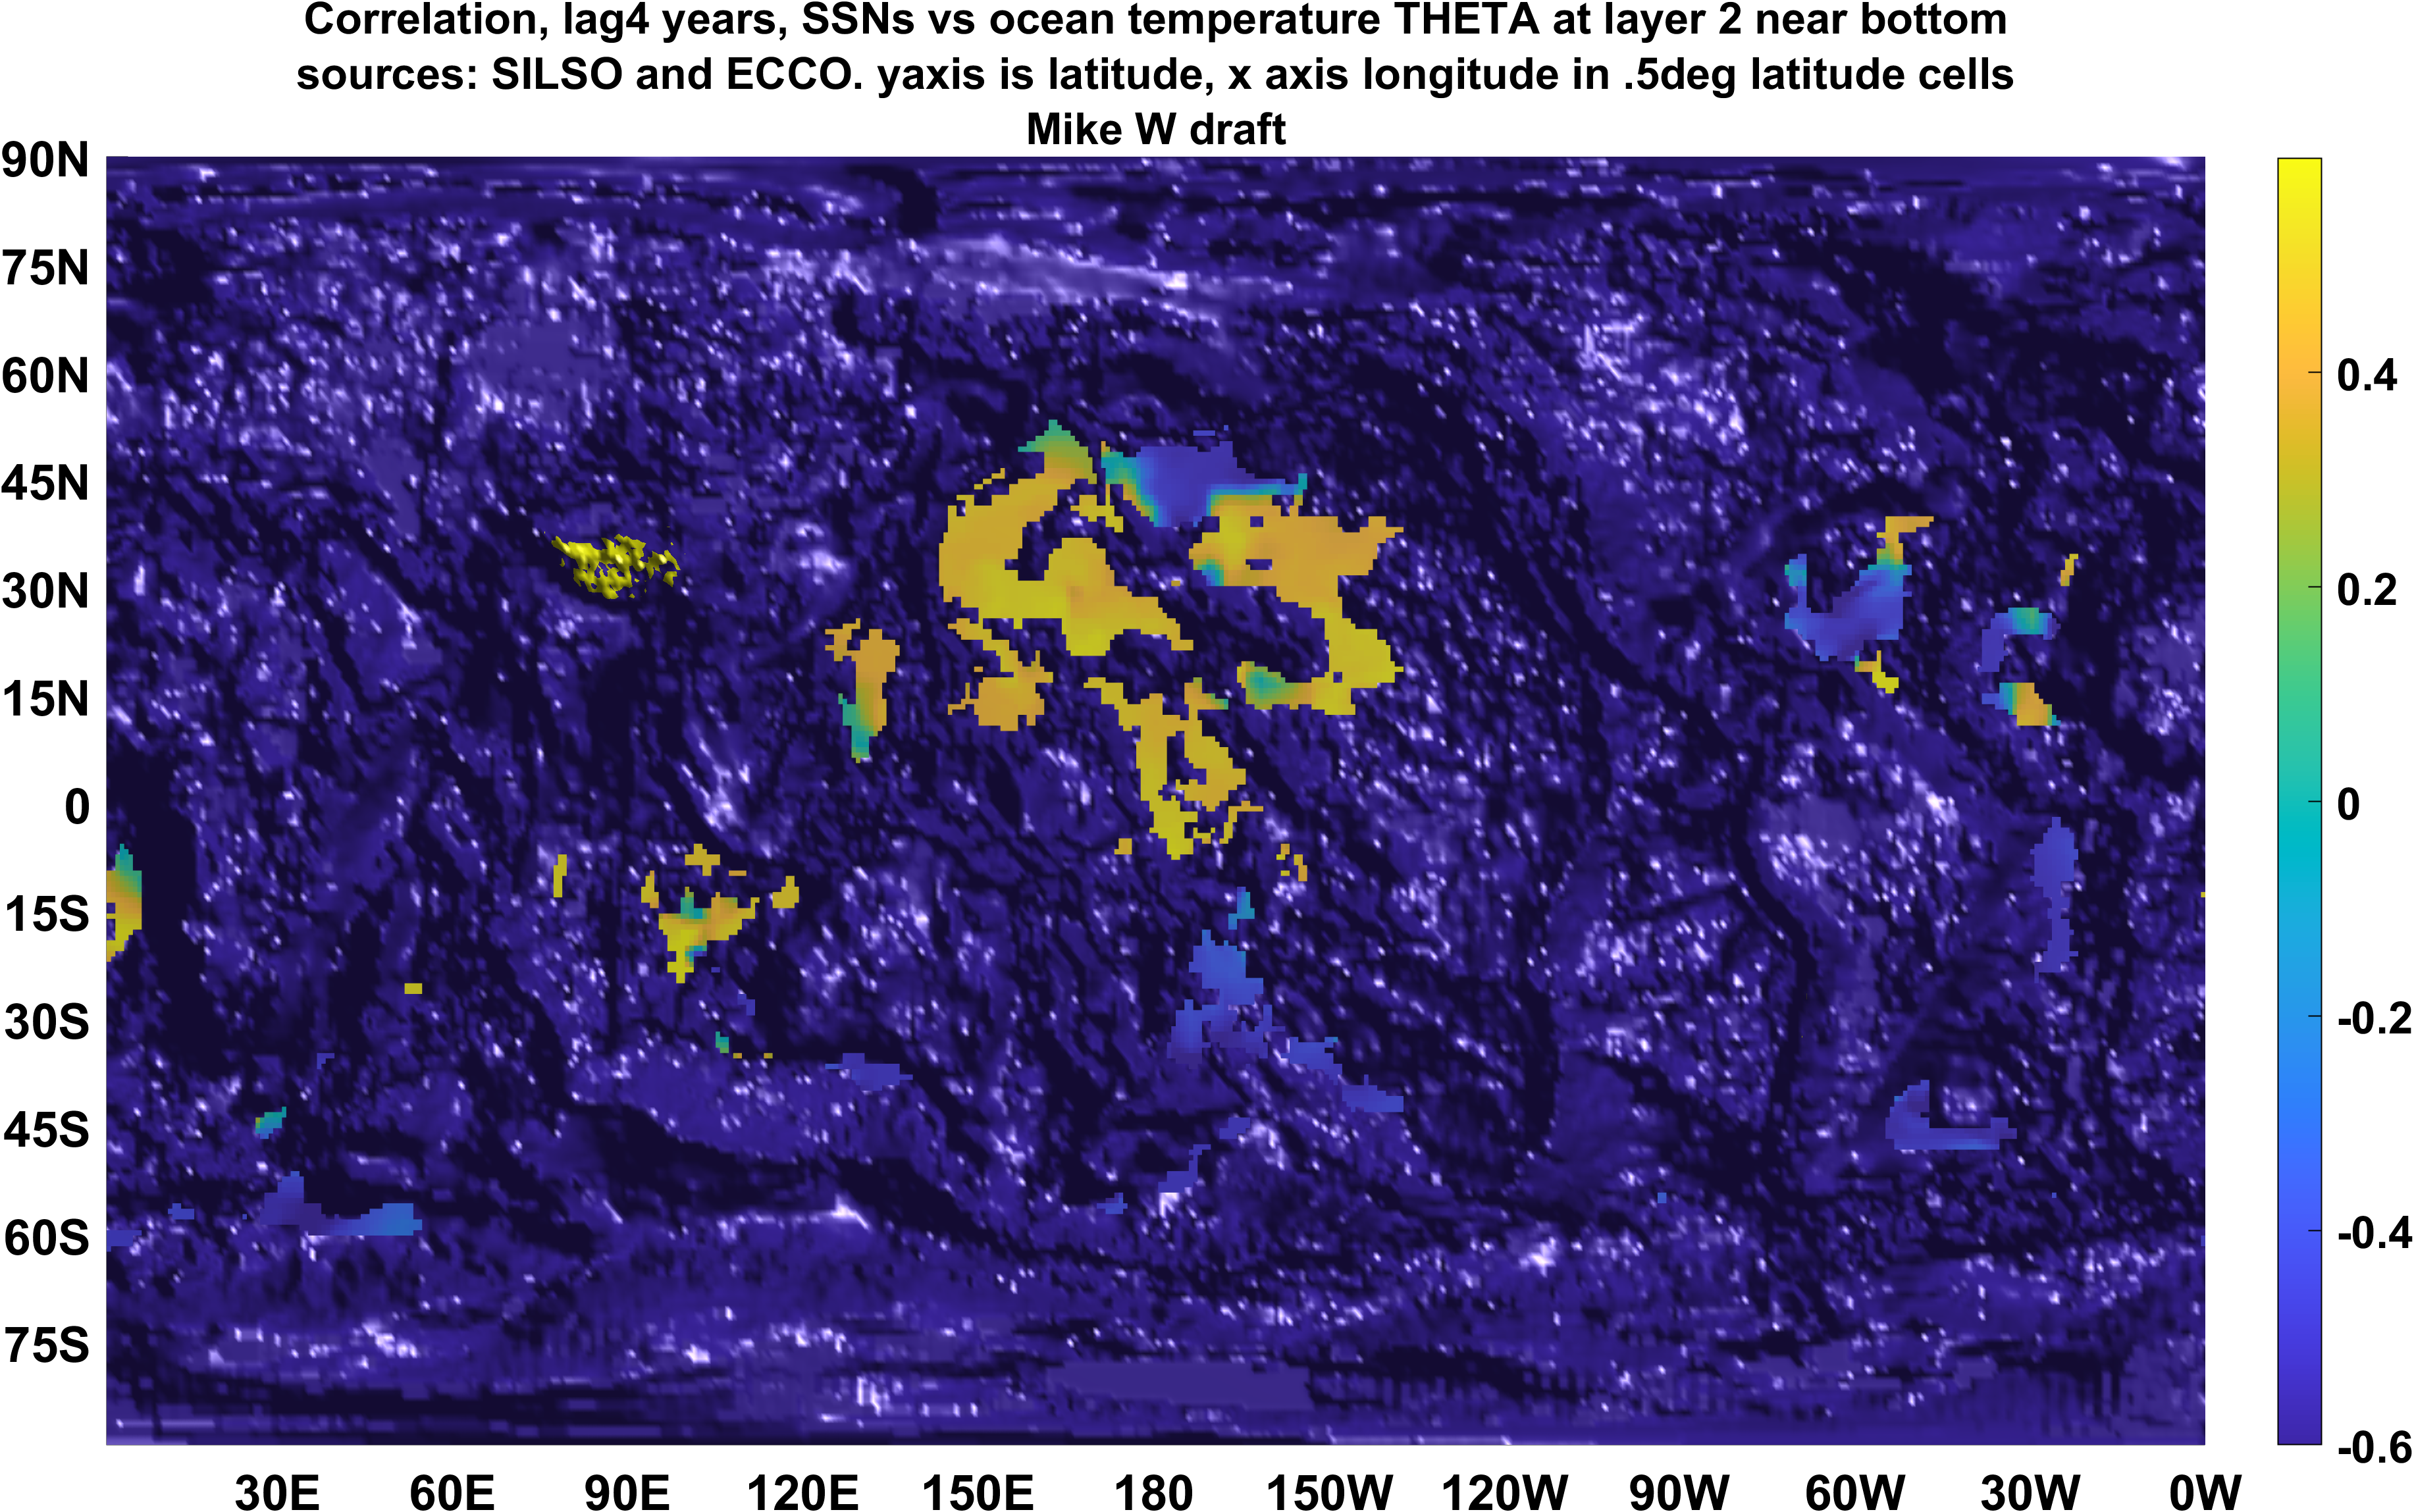
I explore lag correlation mapping between solar activity and our climate. I’ve presented at times including at NASA JPL last year. Those who invited me to give this presentation, understand that the evidence of solar forcing of climate is now established to be everywhere, from the top of atmosphere to bottom of the ocean. Here is supporting evidence I recently produced using the 26 years of NASA ECCO ocean temperatures from 1992 through 2017. Please note that the images at top and bottom of this blog include the same ocean solar correlation source data, but they cover different depth zones and so cannot be compared directly.
The still image below complements the title animation, which probes the correlation of temperature at each level to the recent history of solar activity. This is almost as close to the bottom of the ocean that I can go.
Here is an excerpt on draft global profiles of correlations of atmospheric specific humidity (top, left and right) to solar activity that reached the planet 4 years previously. The bottom left panel signifies the same correlation mapping but for global ocean temperature. And finally at bottom right, the same correlation mapping to solar activity for global ocean salinity. At R ~ .3, the atmospheric correlations are statistically significant. Because of this, selected regions of the planet can benefit from better multiyear terrestrial and marine climate and environmental forecasting.
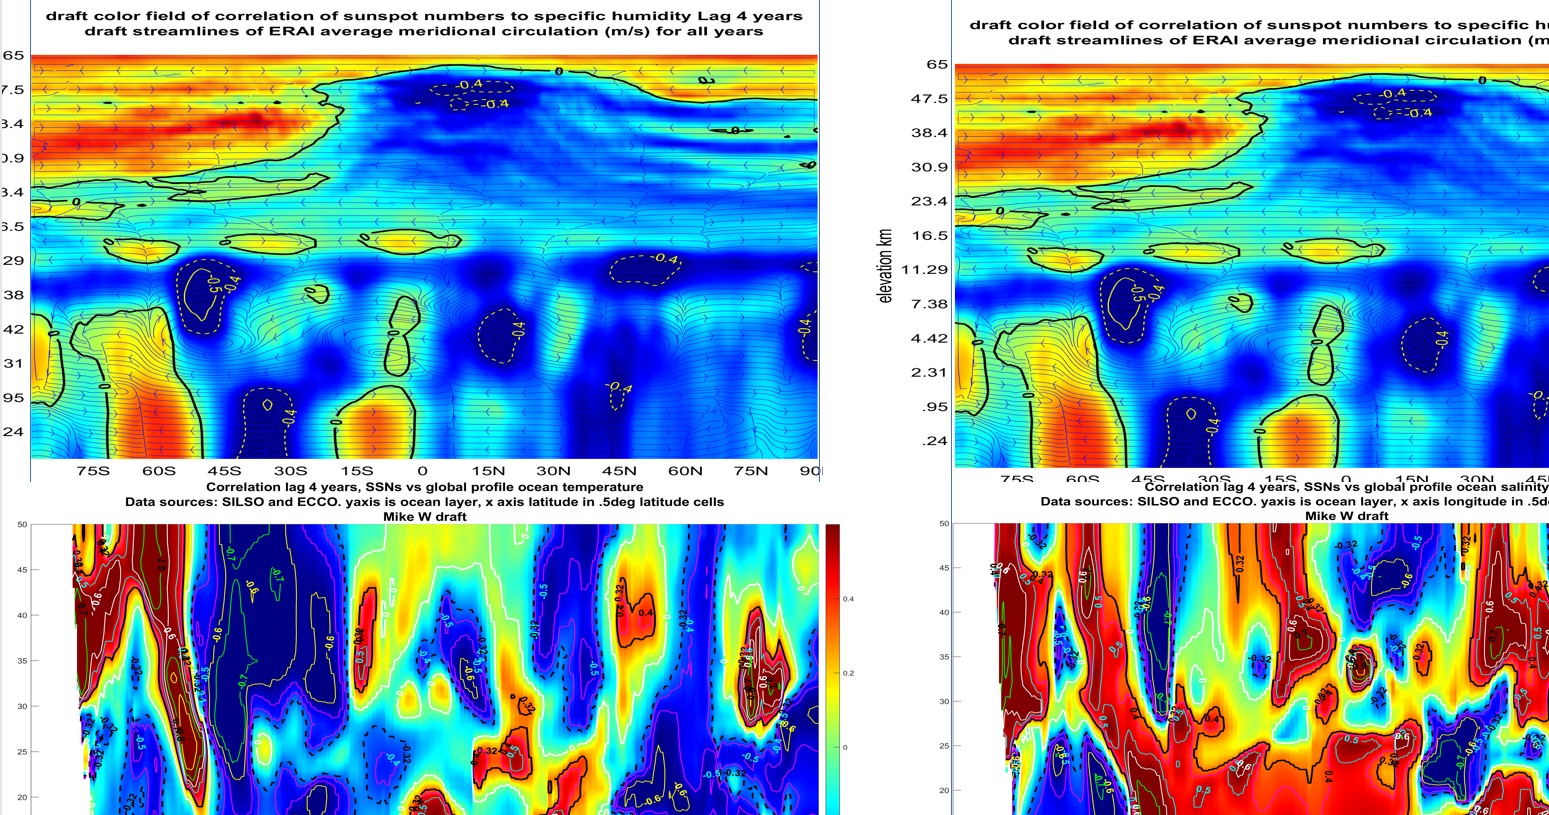
Ocean signatures of solar forcing seem as strong as atmospheric signatures. And the synchronicity of the solar correlations to land and ocean are striking. These are new perspectives and frame our approach in research and in the community, targeting better climate projection at any latitude, longitude, elevation and depth.
 9045total visits,27visits today