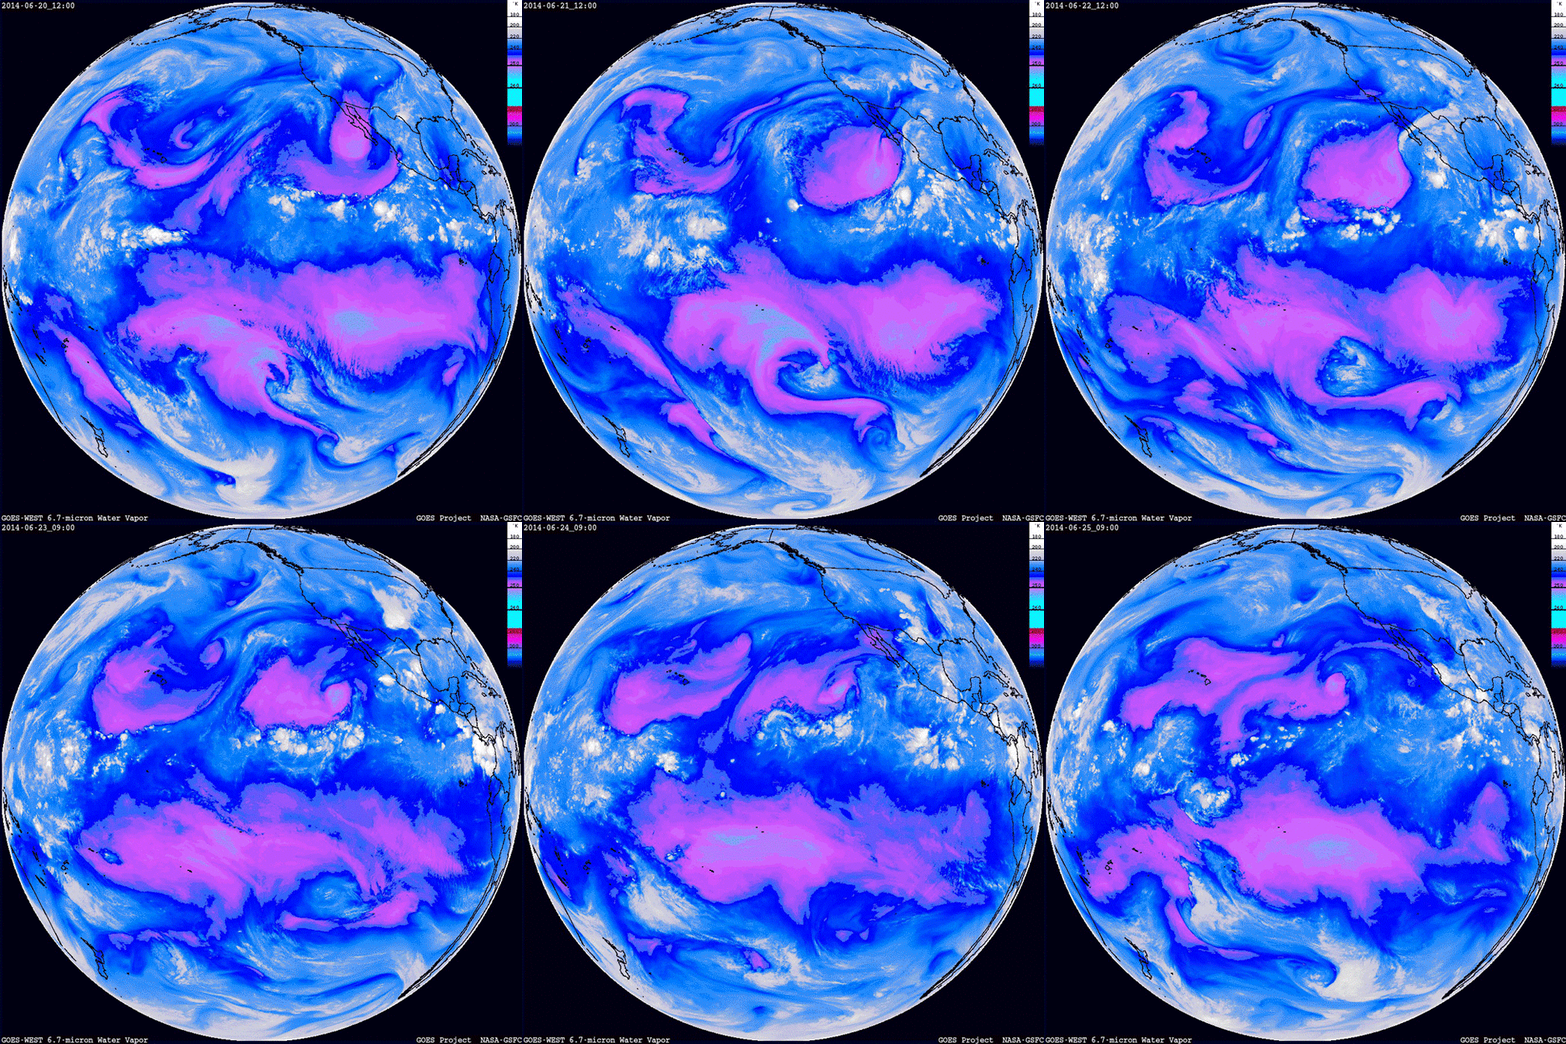
I have downloaded this file from NOAA at:
https://www.nasa.gov/sites/default/files/watervapor_overviewwest-1.gif
This .gif file is an animation of satellite derived water vapor fluctuations across the central pacific ocean over a 5 day period. The Doldrums and Trade Winds are clearly visible. Also the increase in equatorial vapor concentration towards the western portion of the ocean is duly noted.
 3791total visits,2visits today
