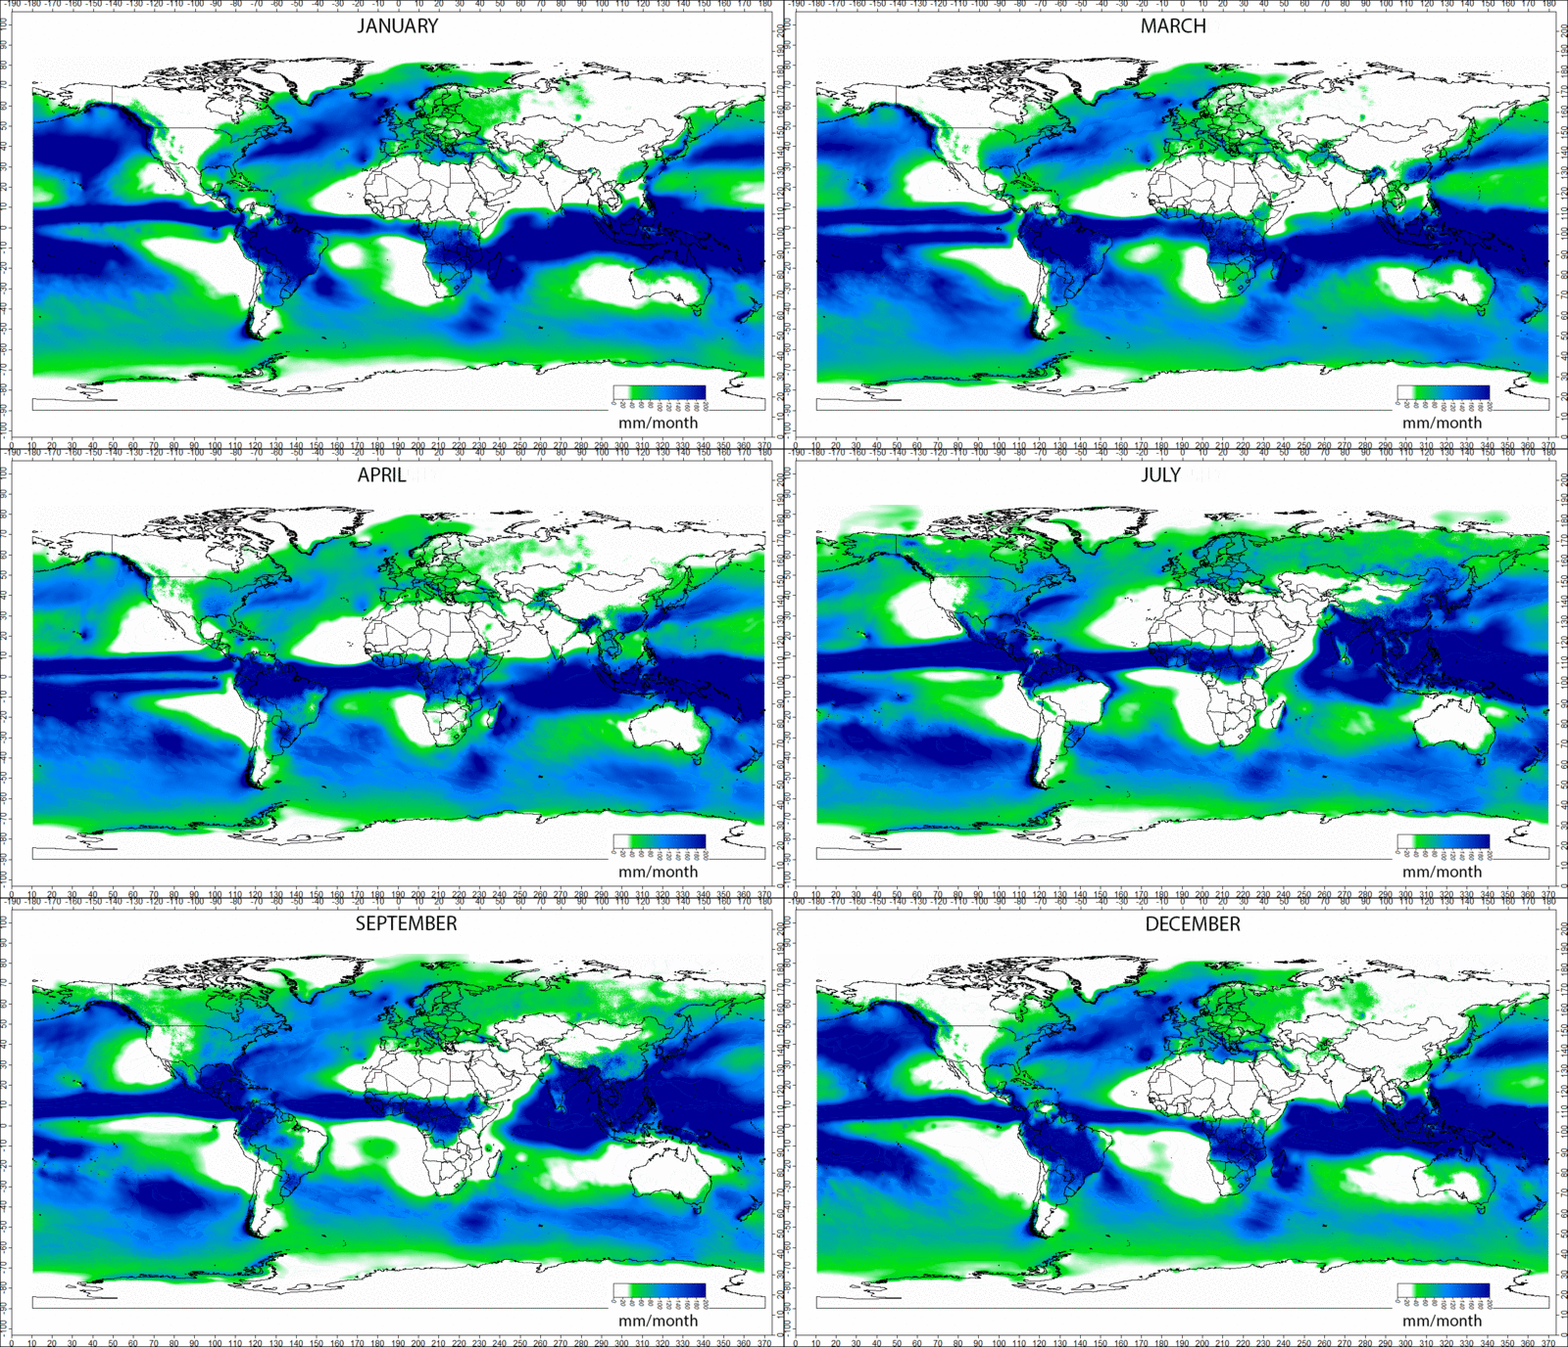
Those who are interested in where and when it rains may enjoy this animation from Wikipedia, by: Greenmind1980
https://commons.wikimedia.org/wiki/File:Precipitation_longterm_mean.gif
I like it also because it happens to match well my own equivalent animation based the ERAI data set for the full atmosphere.
I I
I find both animations to be complementary. It’s not a contest in other words, even if I tend to point out some things from my animation which I am more familiar with. One interesting difference is that Greenmind1980’s animation focuses on precipitation at the surface. Mine captures precipitation and evaporation (it is actually “evaporation minus precipitation”, or EP). Accordingly for example, the oceans are always evaporating (except when raining). Given this difference, rather than no color, one can see a relatively uniform bright green across those expanses. In addition, when it is neither raining nor evaporating, the color is a dull green.
Also for my animation, after a rain pattern passes an area, it leaves an “evaporation streak” of green in its wake. One of the best examples of this can be seen across Africa, especially over the Sahel region. I guess it is also helpful in mine that one can see artifacts of orography and of major water bodies. The wrinkles in the land forms are purely from that orography influence (topography in other words, along with associated rain shadows and rain concentrations). Also take a look at the Great Lakes in the central US. You can see them both when they are evaporating and when they are receiving rain, even though I didn’t do a thing to outline them otherwise. These are signatures you won’t find in the top featured animation.
On the other hand it is clear from the featured animation what the source is of Hawaii’s stationary wet spot. I’ve puzzled over that in a previous post or two. From the featured animation perspective, it seems more plausibly to relate to the orbital/seasonal patterns which are well known, augmented by Hawaii’s high altitude “sky islands”.
Finally it is interesting that my coverage derives from EP for the full atmospheric thickness. In that sense it also likely captures virga rain (phantom rain) in interesting patterns.
Moreover, in spite of any differences, the two together help to confirm the ongoing value of a simple full thickness atmosphere (geostrophic) approach to global climate. Consider comparing to the poor fidelity, intensely complicated, multi atmospheric layered productions of global climate models (gcms) which are routinely used to support something somewhere which cannot otherwise be observed. I’ve been interested for example in the apparently irreproducible Madden Julian Oscillation (MJO) for example and which relates to some past and future posts.
 15663total visits,12visits today
