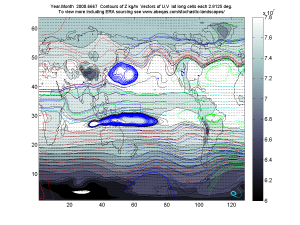
This graphic media is placed here for convenience in support of a current guest post at this link at the climatology blog WUWT:
The Quasi Geostrophic Global Atmosphere and Related Gyres
Figure GACoWUWTJune2017 A
Click below to reach animation at:
Next, Figure GACOWUWTJune2017 C. I haven’t reviewed the orientations to be fully certain they are roughly the same view and scale. If that bears out then it seems that the Antarctic QG Z may swivel relative to its auroral oval in addition to other variations. I’m learning much spawned by this discussion at WUWT which includes other experts that explore solar aurora signatures and climate.
Noting informally the similarity of the QG representation to this Wikipedia sources image of that hemisphere, especially over the Antarctic continent. I don’t know the particular month of this map and it may be a schematic. The general zonations captured by the QG and the conventional illustration are also apparently roughly mirrored by the aurora image. As stated, I am only randomly exploring examples.
Next Figure GACoWUWTJune2017 D
Please obtain Silverman, S.M. 1992. “Secular Variation of the Aurora for the Past 500 Years” Reviews of Geophysics 30, 4 p. 348.
Next Figures GACoWUWTJune2017 E and F
As long understood, the patterns of all three parameters: ozone holes, aurorae, and QG Z values about each pole are roughly centered within the Arctic or Antarctic circle, and otherwise variations are clearly considerable. In this informal excerpt of January 2014 QG Z first and an aurora forecast for the same hemisphere within that month as the subsequent image. Although continguous long record monthly maps are now available for the QG Z images, the same apparently is hard to find currently for aurora maps around each pole.
Perhaps the last informal image of this post will be this item below which is a similar overlay to the previous, but for the month of November 2013, a month already featured as a precursor month to the Great Polar Vortex of 2014. The outer dotted line roughly covers the northern jet stream and the inner lines roughly capture Z contours from the ERA interim source data.
 5432total visits,3visits today


