PDO & New Mexico River Patterns of the 1990s
 Touch or click on image to activate animation.
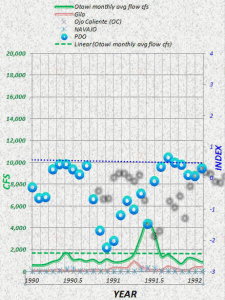
Please see other posts for more coverage of the sometimes remarkable correlations between the Pacific Decadal Oscillation and New Mexico streamflow hydrographs. This is a small animation for the time series of these features over the first half of the 1990s.
In a previous set of posts I barely explored the stochastic landscapes of two of these time series shown, the PDO and the Otowi gage along the Rio Grande. This animation is simply another means to graphically assess some of the same information. I will add more animations like this over time.
 5047total visits,2visits today

