Hemispheric Annual Moisture Vortexes?
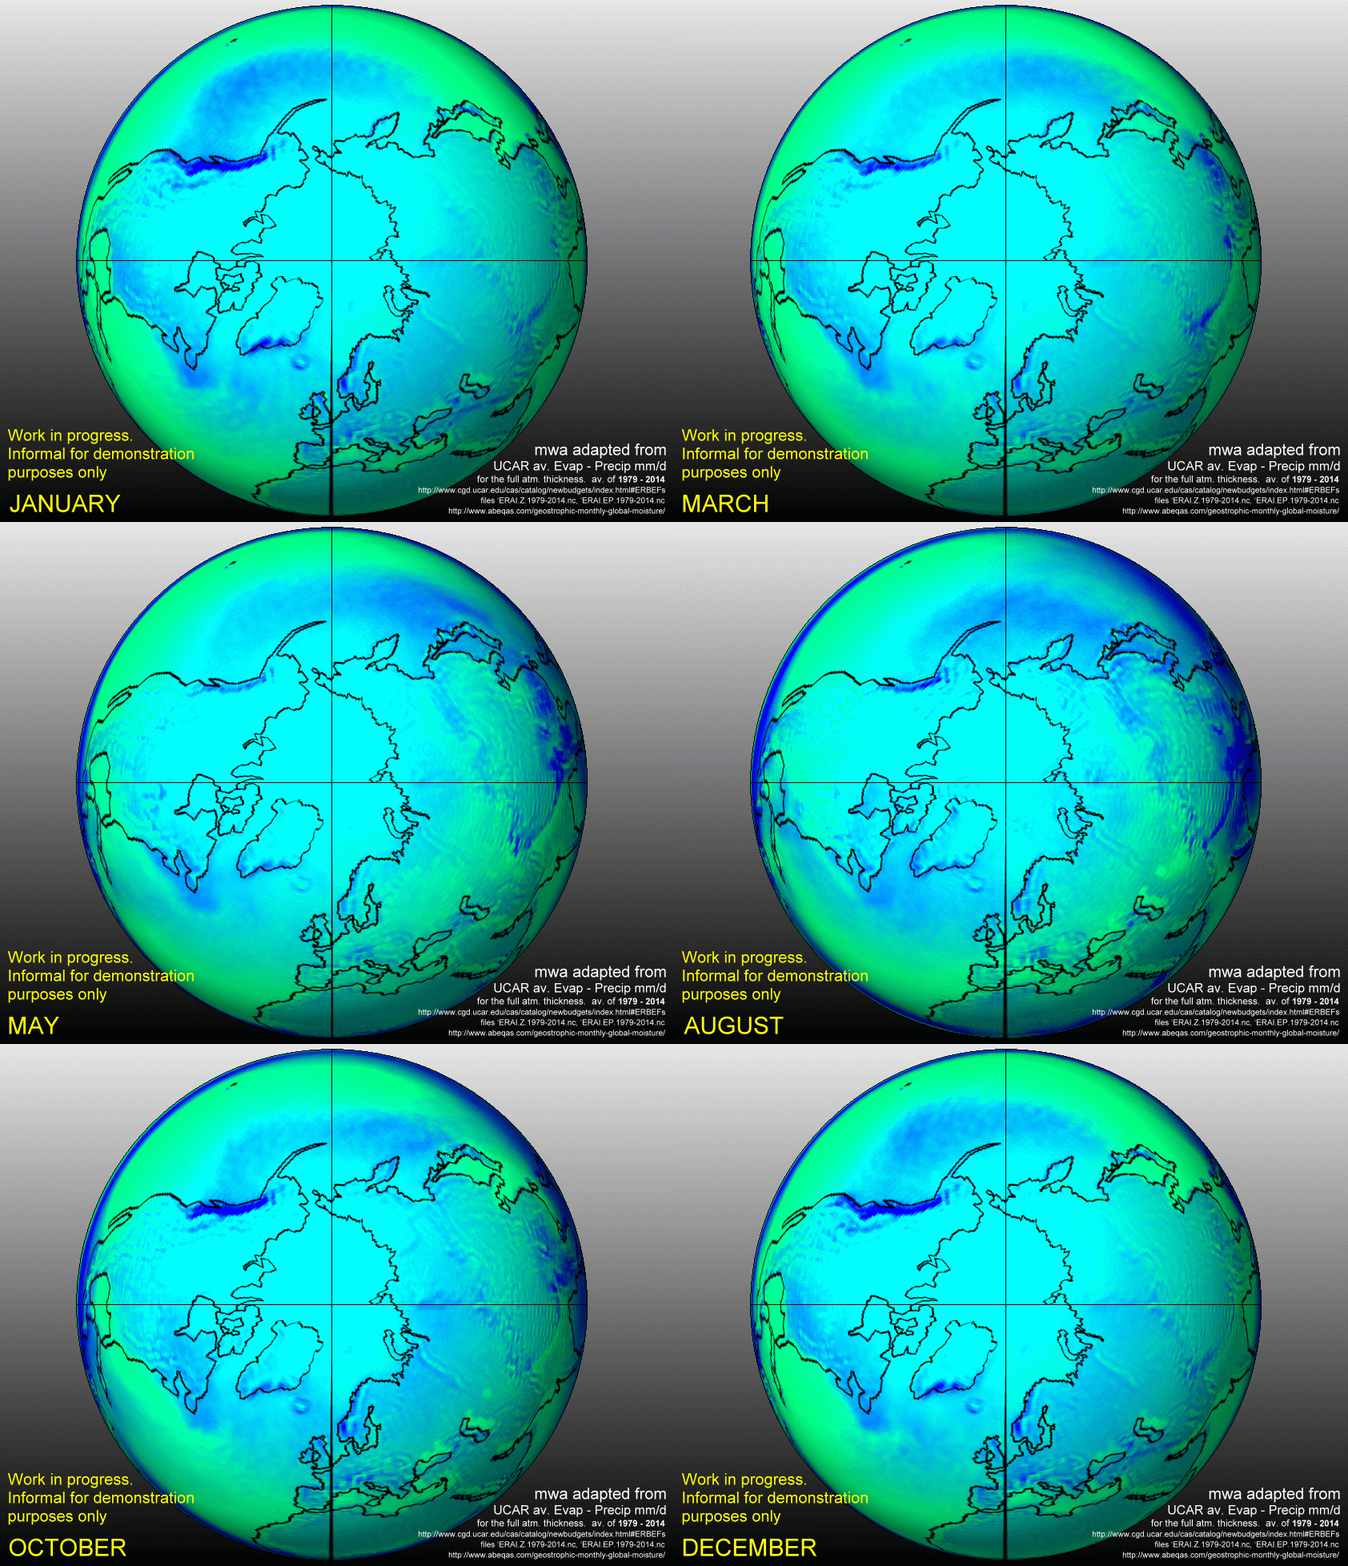
This is a supplemental view of the work at my previous post. Until I viewed the same data in this hemispherical approach, I wasn’t aware of the apparent spiral flavor to the waves of atmospheric moisture for the full atmosphere on a monthly resolution. Picture the tilted Earth as the seasons advance, and one can more easily understand the blue sub-equatorial moisture reaching the mid latitude westerlies of the Northern Hemisphere by summer, upon which that moisture collides and passes across the Pacific Coast of North America. The sharp and deep blue line of that encounter is clear in this animation. Moreover, as the boreal autumn advances to winter, the sub-equatorial moisture band retreats to the south and the westerly flows of atmospheric moisture accordingly diminish. This also is clear from the southern migration and fading of the Pacific coastal blue band just mentioned.
I happen to think that almost everything one can observe from this animation fits with overall moisture circulation characterizations. Any are welcome to explore of course from this animation and others, including a convenient set of representations at this site’s Climate Gallery.
Acknowledgments: Many thanks to Bob Endlich, Bernie McCune, and David Tofsted as well as the other fine members of the Las Cruces Atmospheric Forum. Their patient mentoring and many additional climate observations helped to make these geostrophic maps become visible, even when we can often disagree.
 6331total visits,3visits today

