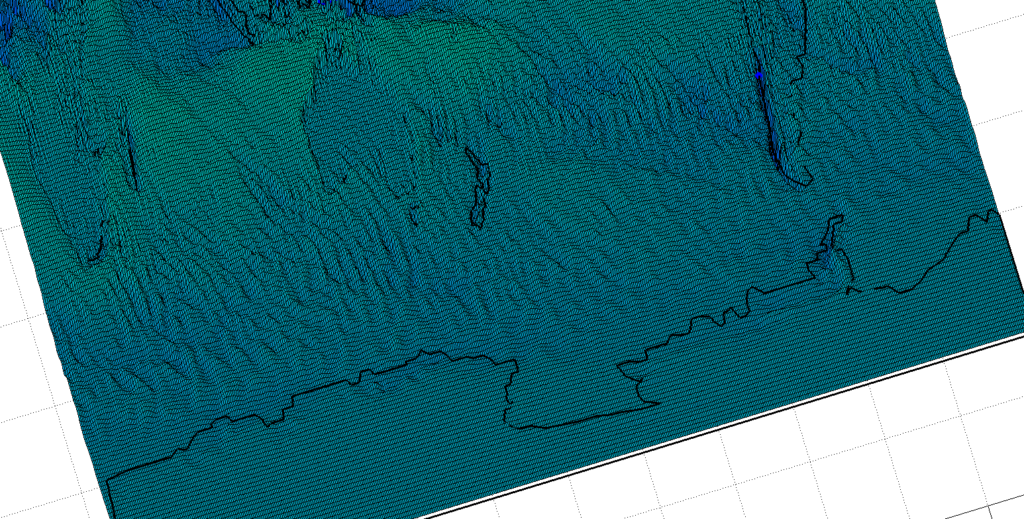
Geostrophic Atmospheric Moisture Waves
Update 2018: Related research on my part suggests that the atmospheric moisture waves are closely related to a larger scale of the commonly observed Kelvin – Helmholtz cloud waves. That makes sense in my view for numerous reproducible tests.
Original 2017 post below:
In a recent post I introduced a new atmospheric wave pattern that I stumbled upon in working on a hydroclimatology paper.
I’ve since looked at it further and shared with some colleagues.
Given the integrated flow patterns observed through a limited sample of profiles, it may be that in addition to possibly common eddies in the hydrosphere at the continental margins, some of the numerous QG North Atlantic and Pacific depressions and ridges profiled in the atmospheric moisture profiles are “palimpsests” of continental profiles which have migrated eastward relatively intact from previous weeks.
The profiles may have been captured via monsoons and smaller meridional fluctuations in the ITCZ and others. Perhaps after each fluctuation was spent, the remaining imprints in atmospheric moisture drifted to the east over a period of days to weeks without significant mixing. Or maybe not. Hopefully much interesting and useful research will follow.
For the featured July 1979 Southern Hemisphere image, interesting patterns continue including the vast Southern Annular Ocean and the distinctive continental imprints.
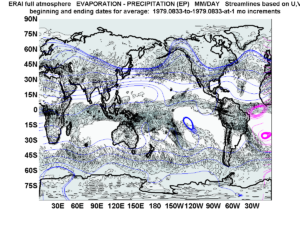
A simpler 2D contour of the same moisture parameter (ERAI EP monthly) for a boreal winter month of the same year, with annotations and registers for the entire planet is also of interest and is included below.
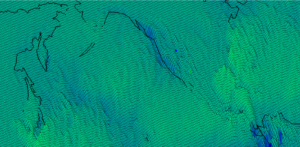
Any random exploration of the data seems to confirm to some extent. Next I chose to examine the same parameter for the month of December 2010. According to Wikipedia, an atmospheric river flowed into the California Coast as this image shows.
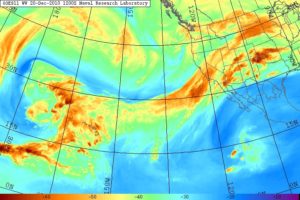
https://en.wikipedia.org/wiki/Atmospheric_river#/media/File:Atmospheric_River_GOES_WV_20101220.1200.goes11.vapor.x.pacus.x.jpg United States Naval Research Laboratory, Monterey
Accordingly I took a look from the EP monthly average oblique surface map. It appears there was an overall depression for that month which brought moisture to that region. As usual the other EP waves are prevalent in barotropic portions of the middle latitudes.
Draft work in progress and opinions are included.
 5697total visits,3visits today
